Single Candle Patterns (part 2)
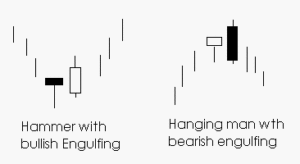
Hammers and Hanging Man patterns

When they are confirmed, they become powerful signals for reversals. The color of these two patterns is unimportant, but some consider white hammers and black hanging man’s to be more reliable signs of reversal. These two patterns indicate a bullish trend with low to moderate rates of reliability.

- If a lower shadow is present, it is two to three times the length of the real body.
- Little or no upper shadow.
- The real body is at the upper end of the trading range.
- The color of the real body is not important.
Shooting Star Candlestick Pattern
This pattern occurs when the gaps in the market open above the gaps present when the previous day closed in an upward trend. The stock will rise to a new high, but then lose strength and close near it’s low suggesting a bearish momentum change. This trend reversal would be confirmed by the market opening the following day below the body of the shooting star. If both the open and close rates remain the same, it indicates a gravestone Doji. The shooting star pattern indicates a bullish trend and has a reliability rate that ranges from low to moderate.

- A very long upper shadow.
- The small real body is at the lower end of the price range.
- The real body gaps away from the real body of the previous day.
Hollow Red Candles Pattern
This pattern is indicated by stocks that have a red, hollow candlestick at the end of their daily chart.
Filled Black Candles Pattern
This pattern is indicated by stocks that have a solid black candlestick at the end of their daily chart.