Single Candle Patterns (part 1)
There are some types of single candle patterns in candlesticks’ theory. They are the following:
- Dragonfly Doji
- Gravestone Doji
- Hammers/ Hanging Man
- Hollow Red Candles
- Filled Black Candles
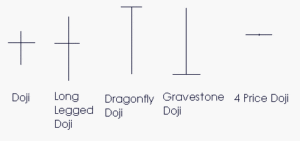
Doji’s

Doji’s become more significant to the market when they appear after and extended period of long bodied candles, whether they are bullish or bearish and is confirmed with an engulfing. They follow a bullish trend and only have a moderate rate of reliability.
Long-legged Doji
A long legged Doji candlestick forms when the stocks open and close prices remain the same. This Doji is much more powerful if it is preceded by small candles. It indicates a sudden burst of popularity in a stock that previously hasn’t been very popular, thus can imply the beginning of a change in trend.
Dragonfly Doji
Dragonfly Doji’s are Doji’s that opened high in the market, experienced a notable decline, but received enough support to close at the same price at which it opened. They are often seen after there has been a moderate decline and when they are confirmed with a bullish engulfing, they are indicators of a bottom reversal. Dragonfly Doji’s indicate a bullish trend that offers moderate reliability.
The Dragonfly Doji has a higher reliability rate associated with it than the Hammer does.
- The long lower shadow is about two to three times the size of the real body.
- There is very little upper shadow, or none at all.
- The real body is at the upper end of the trading range.
- The color of the real body is not important.
Gravestone Doji
Gravestone Doji’s are the opposite of the Dragonfly Doji and when confirmed with a bearish engulfing, are the top indicators for a reversal. Appropriately named, they look like gravestone’s and could forecast doom for the stock. When the stock opens and closes at the same level after Forex trading, it’s referred to as 4 price Doji’s. This very rarely occurs and is generally only evident with securities that are thinly traded. This is a bullish trend that provides investors with moderate reliability.

- Small real body at the upper end of the trading range.
- Upper shadow usually at least three times as long as the real body.
- Very little lower shadow or none at all.